
I’m poorly (I might write a post about that) so what better way to spend you evening than mucking around with graphs?
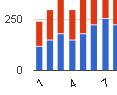
Below is a stacked chart, representing the bike and run minutes I’ll be doing over the 30 weeks – I haven’t got a time for the swim bits yet.
Not at all worrying, is it??