
Ok, so you’ve got to grips with setting up your chart in ‘The training spreadsheet, part 1‘ and you know how to set up your plan. You’ve understood the absolute greatness of pivot reports in ‘The training spreadsheet, part2‘ for selecting and filtering data and putting charts together and you have fully acknowledged the greatness of Googledocs and/or spreadsheets in general. You probably think that the previous posts will one day be recreated in some Hunger Game style trilogy of films one day. I know I do. Good. Now it is time to start analysing the actual runs. From here on in, this will be called ‘The fun stuff’. Again, i’m using this spreadsheet here: http://goo.gl/Msd62O.
Don’t get me wrong, the previous set up will work just fine. For ages that is exactly how I had my Ironman training plan (did I tell you I once did an Ironman?) but one day you are going to look at it and think ‘I wish I could do more’. And you can.
What have I done?
What I really want to do now is track exactly what I’ve done with some reports. I might like a little table that totals up all the workout’s I’ve done. Well, because we have that ‘Complete’ field in the training plan we can.
- Make a new pivot report
- Add the field ‘Type’ to the Row
- Add Complete to the columns
- Add Minutes to ‘Values’
- Add ‘Type’ to filter and just pick a couple. I went for cycling, swimming and running
My pivot table now looks like this:
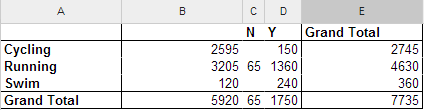
Column B is showing the total minutes with no N or Y in it (so workout’s in the future), N are the ones I’ve missed (tut tut) and Y are the ones that are done. Notice how there are total columns for both rows and columns. Sometimes this is useful, sometimes it’s not, so handily enough you can turn them on and off in your Report Editor window by clicking ‘Show Totals’. Brill!
Important point. You can have multiple fields in EVERY area on that report editor. We *might* use this later on, but right now, just take a second to appreciate how cool that report is. It’s summing up the minutes and complete status of every type of exercise in your plan. If you wanted to you could do a little sum to see how far through it you are. And the best bit is that is automatically updates as you add your Y’s. Aces!
So we can report on work out’s we’ve done. Now if only there was a way to track our performance too? Wait a second, there is!
Performance
Quite simply what I want to do with my running is see if I’m a) getting further each week and b) getting faster. So to track this we’re going to need to add a few columns to our training plan. I’m going to add:
- Completed minutes. I’ll type in exactly how many minutes I did. (I’m going to be smug here and say you shouldn’t need this column because you should just do every minute listed in the plan when you start each session. Slacker.)
- Distance
- Pace
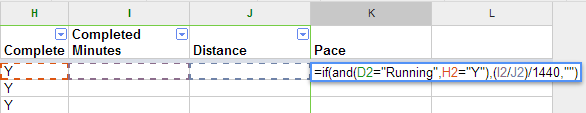
Now for the moment you can type in all of these manually if you want. If you don’t like formula’s (Lozza) just do that. If you do like formula’s well then we can automatically work out pace can’t we because it’s just a sum of distance and time. The formula I have in K2 is:
=if(and(D2=”Running”,H2=”Y”),(I2/J2)/1440,””)
Now, I only want to work out a pace if the workout is flagged as complete and the workout is running (I’ve yet to work out a measure for speed of yoga. Damn you yoga) so I have an ‘if’ statement checking that. I then divide distance by time in minutes, and divide the whole sum by 1440 (the number of minutes in a day). I format the whole cell into the ‘hours’ format in Googledocs and it gives me my pace per mile. Trust me it works. I copy that down the whole spreadsheet.
So now I know how fast I’ve been on every run. I know what you’re thinking. You’re thinking, ‘why don’t we put that on a graph and cross reference that with how far we’ve run?!‘ and that’s why I like you. Well, that and you smell nice. Yes if we do that graph it might just tell us if we’re getting fitter and faster. Cool!
Right let’s get on it. Add another pivot report, select your data, go to ‘Data’ then ‘Pivot table report…’. Let’s think about what we want first though. We might want to break it down by weeks, and get the average pace for those weeks with the total distance, for only the running activities we have completed. So….
- Add ‘Weeks’ to Rows and remove the total flag
- Add both ‘Pace’ and ‘Distance’ into the Values section (order is import here)
- Add both ‘Type’ and ‘Complete’ into the filter section and filter by ‘Running’ and ‘Y’
You’re done right? Actually no. The pivot chart defaults to summing all the values together. This is exactly what we want with distance, the grand total of all your hard earned miles over the week. But in pace, we really want an average. So go back to the values box for Pace and change the ‘Summarise by’ from ‘SUM’ to ‘AVERAGE’. Highlight the whole column and make sure the format is ‘Hours’ too (highlight the column, go to ‘format’, ‘number’ then ‘hours’. Taaa daaaaa:
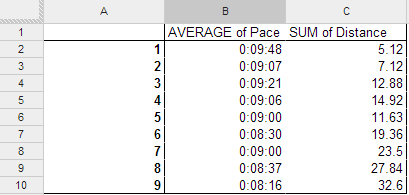
(note, this isn’t quite perfect as not every run is equal, I could skew the figure by going and sprinting for 100m, but my training isn’t really like that, so it’s fine for me.)
So this is a nice table but a graph sure would be prettier. Select columns A through to C and go to ‘Insert’ then ‘Chart’. Do this:
- Select ‘Use row 1 as headers’
- Go to ‘Charts’ and select ‘Line’ then ‘Combo chart’
- Go to ‘Customise’ and then scroll down to ‘Data series’
- Select ‘Data series 1’ then set to ‘Right axis
What we want (who am I kidding, what I want) is a bar graph with the left axis the distance, and the right axis my pace. I want bars representing the total distance and I want a line representing a pace. As the weeks go up my distances should go up and my pace should come down.

Now I can go and do the same thing for cycling maybe and start building lots of other fun charts and tables. Go on, do it. You know you want to.
All this is pretty cool, but I’m lazy. What I really want is some way of automatically linking my Garmin Connect account to my plan because I don’t want to have to write anything in about my training. That is what computers are for… Well there is a way to do that too… The training spreadsheet, part 4
Good day sir,
I would be very thankfull if you would send me your sheet to my mail, so I could learn from it at adjust it to my needs. thank you