
Training spreadsheet
This post is going to tell you all about setting up the ideal training spreadsheet and why you need one. Before I begin, let’s get a couple of things out of the way:
- I like training
- I like spreadsheets
- I like graphs
- I may well have shown more people my ironman training spreadsheet than my medal
If you don’t like any of these things, these posts are not for you! What I’m going to attempt to describe is setting up a marathon or other training plan on a spreadsheet, doing some reporting and best of all linking to your garmin connect account so you can really see how your training is getting along. This splits nicely into three posts, which are pretty much easy, medium and hard. Anyone will be able to do one and two, three is for your spreadsheet ninja’s. Have a go sure, but don’t come crying to me when all your cells have gone on the wonk.
Why do a training spreadsheet?
Well you’re going to be training for a marathon for 16 weeks, or an Ironman for 30+. You need to keep track of what you are doing, what you have to do and log where you have come from. Spreadsheets are easy to write, easy to update and can produce pretty graphs. I did all of my stuff using the googledocs spreadsheet. I would hugely recommend this because:
- You can access and update from anywhere. You have no excuse to miss your training.
- The graphs are like, really, REALLY pretty.
- You can share your spreadsheet with people to show off how pretty your spreadsheet is.
- You can publish the results direct to your blog.
- It’s free.
See, isn’t it pretty? Also, aren’t I doing a nice mix of non-running stuff? Yeah, go me!
If you’ve not used it before, well we probably can’t be friends. Oh ok, maybe we can, but I’m not sending you a Christmas card. Googledocs is here: https://docs.google.com.
Before we go any further let’s talk about data.
Spreadsheets are super flexible and there are 100 ways to set things up. I’m not going to tell you my way is the best (you’ll just have to figure that out on your own), but what I will tell you is that a really common mistake is mixing up the data in your spreadsheet with presenting that data. We are not going to do that.
When setting up your beautiful new training plan, imagine the kinds of thing you might want to track. I would guess it’s going to be something like:
- How many miles/minutes you have to do
- How far you have done
- How fast you are
- When you have to do it
We really only want to list this stuff out once, but our reports might change based on how far through the plan you are or how boring you want to make your graphs (“Ohhh I wonder how far I’ve run on Mondays?“). There is one solution to this, a word that might make you run off screaming in fear….
Pivot charts.
There, I said it. I’ll talk about them in post two but let me be clear about this: If you are using spreadsheets and not using pivot charts, you are doing it wrong. When you do this once, you will laugh and look down on everyone that can’t do them. You’ll impress people at work, you might get a pay rise and you’ll almost certainly be more attractive. Well, to me anyway. The best thing? It’s really easy to do.
Still with me? Good.
So what does this magical spreadsheet look like:
Training Spreadsheet
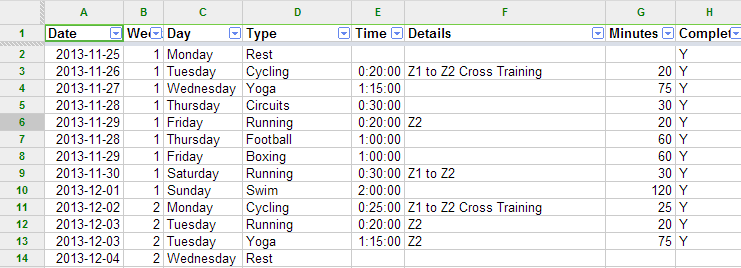
Ok, it’s not that magical now, but it does have some key things:
- All of the data is in one list, right down the page. There are a hundred or so rows.
- Each bit of exercise is in it’s own row
- Everything I might want to report on (weeks, types, time/distance) is in this list
- The details column lists the type of run or workout
- Half of the fields are calculated
What’s that, calculated? Yeah I obviously don’t want to write stuff out more than once if I don’t have to. I’m lazy (plus it’s very error prone). So Day is calculated off the date column, week number is too. The total number of minutes is also calculated from the time field. I should point out I do ALL my training on times not distances. It’s ace and you should try it. Plus it works great for figuring out if you are going faster (by using a graph or the old fashioned method of ‘I’m sure I only ran as far as that bus stop last week’).
After adding a date field in A1 (which you could automatically do, but for a couple of reasons it gets annoying so I’d advise against it). Again, the formulas are because I’m lazy and I mess around with dates and times quite a bit. You could easily just type it in and it would be effective too. The calculated fields are:
Week: =if(C3=”Monday”,B2+1,B2). Which is an if statement that says if C3 = Monday, up the week number in B2 by 1, if it doesn’t just use the value in B2. You have to manually start with 1 in Cell B2, and the formula starts in B3.
Day: =text(A3,”dddd”). This is looking at the date value and returning a text string for the day.
Minutes: =if(E3=””,””,(hour(E3)*60)+MINUTE(E3)). This is taking the time formatted value and converting it into minutes, if a time value exists. I do the if statement to make it neat if I need to add rows, or do activities with no time, like rest days. I’m adding a separate minute field just to ease some calculations later on. It’s easier to work with than a time formatted field in my opinion.
The spreadsheet sample is here: http://goo.gl/Msd62O
So now we have the basic format all ironed out, it’s onto the fun stuff….. reporting. Let’s move to ‘The training spreadsheet, part 2‘.